
Weekly Market Commentary
July 27th, 2026
Week in Review
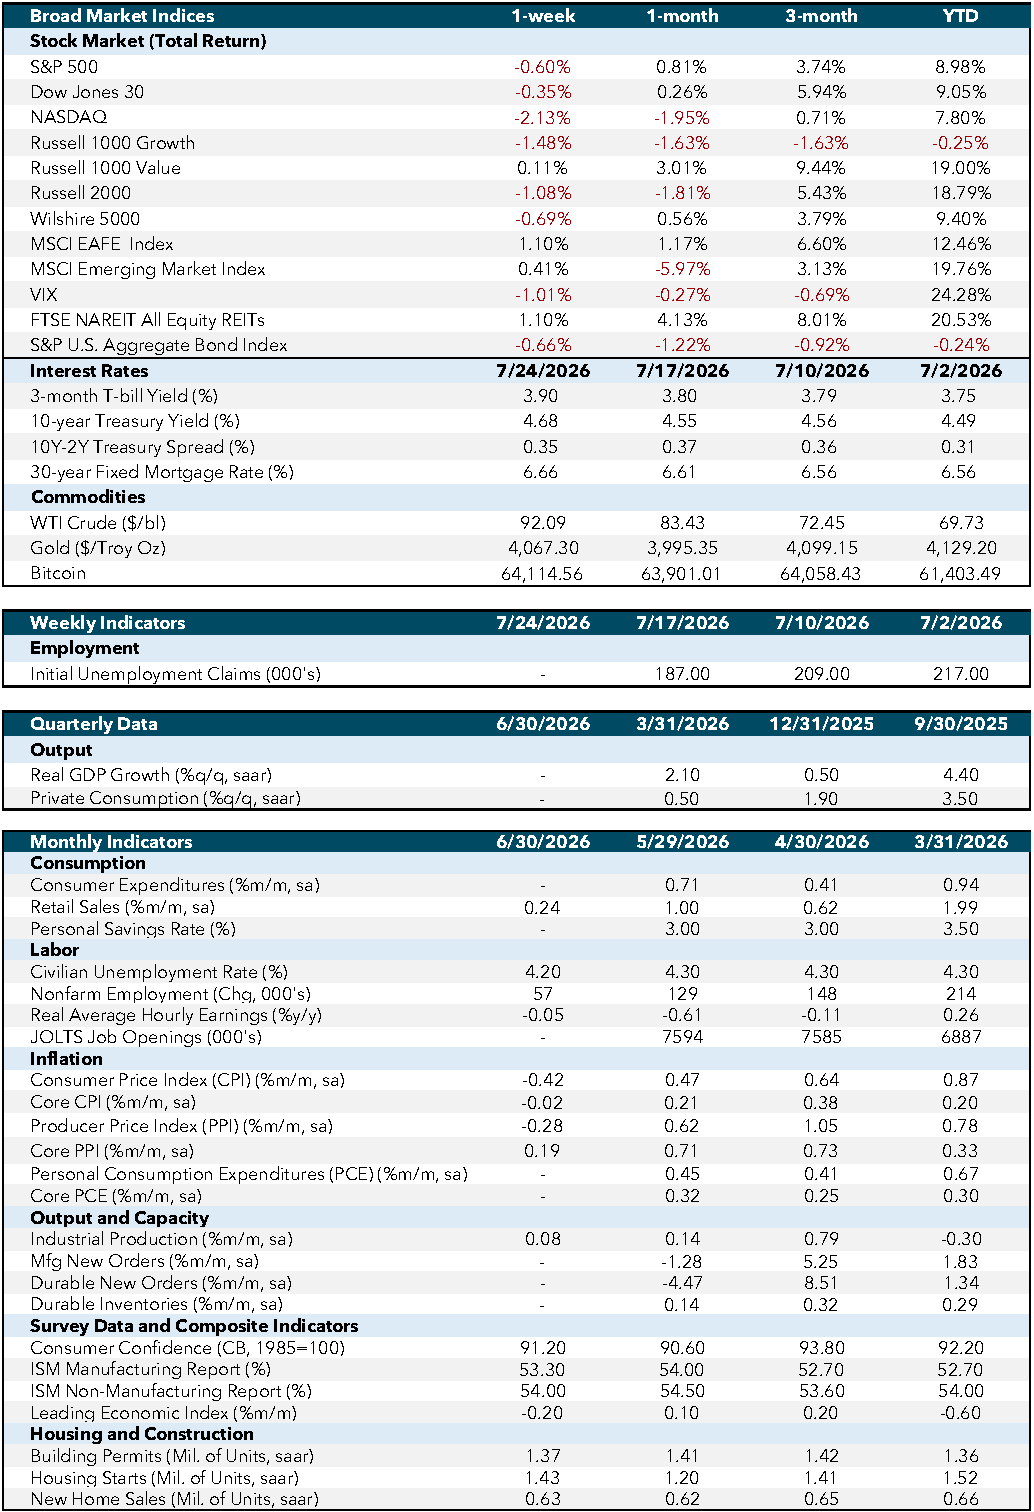
Economic data released during the week pointed to continued economic expansion, supported by a resilient labor market and improving business activity, though inflationary pressures and housing affordability challenges remained important areas of focus.
Labor market data continued to highlight underlying strength. Initial jobless claims fell to 187,000, down from 209,000 the prior week, marking the lowest level in decades. The decline reinforced the view that labor market conditions remain healthy. Continued labor market resilience should help support consumer spending and broader economic activity.
Business activity strengthened during the month. Preliminary July Services Purchasing Managers’ Index (PMI) data showed Composite PMI rising to 53.6 from 51.9 in June, reaching its highest level in eight months. Services activity remained the primary driver of growth, while July Manufacturing PMI eased slightly from the prior month but remained in expansion territory with a reading of 53.8. The data suggested the economy entered the second half of the year with solid momentum, supported by continued demand across much of the private sector.
Energy market data provided a mixed signal on inflation pressures. U.S. commercial crude oil inventories increased by 2.0 million barrels during the week, reversing expectations for a decline. While higher inventory levels may help reduce upward pressure on energy prices in the near term, overall stockpiles remain below historical averages, indicating supply conditions remain relatively tight.
Housing data suggested conditions remain challenged but stable. New home sales increased 1.6% in June to an annualized pace of 628,000 units, improving from 618,000 in May. This increase suggests housing demand remains resilient despite elevated mortgage rates, providing evidence that buyers continue to adapt to higher borrowing costs. While activity remains below the stronger pace seen in recent years, the report indicated the housing market may be gradually finding footing.
Overall, the week’s data reflected an economy that continues to expand at a moderate pace. Strong labor market conditions and improving business activity remain supportive of growth, while inflation and housing affordability continue to present challenges that policymakers and investors will monitor closely.
Economic and Capital Markets Dashboard
Week Ahead…

Markets head into the final week of July focused on several key releases that will help shape expectations for economic growth, inflation, and monetary policy.
The week begins with durable goods orders, which will provide insight into business investment and manufacturing demand. Investors will be watching for signs that capital spending remains resilient despite continued uncertainty surrounding the economic outlook.
Consumer confidence will also be in focus following recent evidence of steady household spending. A stronger reading would suggest consumers remain confident in labor market and economic conditions, while any deterioration could raise concerns about the sustainability of consumer demand.
The Federal Reserve’s policy announcement on Wednesday will serve as the week’s most closely watched event. While no change in interest rates is expected, markets will focus on policymakers’ assessment of inflation, labor market conditions and the potential path of future policy decisions.
Thursday will feature several important releases, highlighted by the advance estimate of second-quarter GDP, the Core Personal Consumption Expenditures (PCE) Price Index, and initial jobless claims. GDP will provide the first broad assessment of economic growth during the quarter and help investors gauge the underlying strength of the economy. The Core PCE Price Index, the Federal Reserve’s preferred measure of inflation, will be closely monitored for signs that price pressures continue to moderate. Markets will also watch initial jobless claims for evidence that labor market conditions remain healthy and layoffs remain limited.
The week concludes with the Chicago PMI and the final University of Michigan Consumer Sentiment data for July. Chicago PMI will be closely watched for clues on manufacturing activity ahead of the national ISM report, while consumer sentiment and inflation expectations will provide further insight into the outlook for household spending and inflation.
Overall, the week’s data should help clarify whether economic growth remains resilient, inflation continues to moderate and labor market conditions remain supportive. These releases will play an important role in shaping expectations for the Federal Reserve and the broader economic outlook during the second half of the year.
Economic Indicators:
- CPI: Consumer Price Index measures the average change in prices paid by consumers for goods and services over time. Source: Bureau of Labor Statistics.
- Core CPI: Core Consumer Price Index excludes food and energy prices to provide a clearer picture of long-term inflation trends. Source: Bureau of Labor Statistics.
- PPI: Producer Price Index measures the average change in selling prices received by domestic producers for their output. Source: Bureau of Labor Statistics.
- Core PPI: Core Producer Price Index excludes food and energy prices to provide a clearer picture of long-term inflation trends. Source: Bureau of Labor Statistics.
- PCE: Personal Consumption Expenditures measure the average change in prices paid by consumers for goods and services. Source: Bureau of Economic Analysis.
- Core PCE: Core Personal Consumption Expenditures exclude food and energy prices to provide a clearer picture of long-term inflation trends. Source: Bureau of Economic Analysis.
- Industrial Production: Measures the output of the industrial sector, including manufacturing, mining, and utilities. Source: Federal Reserve.
- Mfg New Orders: Measures the value of new orders placed with manufacturers for durable and non-durable goods. Source: Census Bureau.
- Durable New Orders: Measures the value of new orders placed with manufacturers of durable goods. Source: Census Bureau.
- Durable Inventories: Measures the value of inventories held by manufacturers for durable goods. Source: Census Bureau.
- Consumer Confidence (CB, 1985=100): Measures the degree of optimism that consumers feel about the overall state of the economy and their personal financial situation. Source: Conference Board.
- ISM Manufacturing Report: Measures the economic health of the manufacturing sector based on surveys of purchasing managers. Source: Institute for Supply Management.
- ISM Non-Manufacturing Report: Measures the economic health of the non-manufacturing sector based on surveys of purchasing managers. Source: Institute for Supply Management.
- Leading Economic Index: Measures overall economic activity and predicts future economic trends. Source: Conference Board.
- Building Permits (Mil. of Units, saar): Measures the number of new residential building permits issued. Source: Census Bureau.
- Housing Starts (Mil. of Units, saar): Measures the number of new residential construction projects that have begun. Source: Census Bureau.
- New Home Sales (Mil. of Units, saar): Measures the number of newly constructed homes sold. Source: Census Bureau.
- SA: Seasonally adjusted.
- SAAR: Seasonally adjusted annual rate.
Market Indices & Indicators:
- S&P 500: A market-capitalization-weighted index of 500 leading publicly traded companies in the U.S., widely regarded as one of the best gauges of large U.S. stocks and the stock market overall.
- Dow Jones 30: Also known as the Dow Jones Industrial Average, it tracks the share price performance of 30 large, publicly traded U.S. companies, serving as a barometer of the stock market and economy.
- NASDAQ: The world’s first electronic stock exchange, primarily listing technology giants and operating 29 markets globally.
- Russell 1000 Growth: Measures the performance of large-cap growth segment of the U.S. equity universe, including companies with higher price-to-book ratios and growth metrics.
- Russell 1000 Value: Measures the performance of large-cap value segment of the U.S. equity universe, including companies with lower price-to-book ratios and growth metrics.
- Russell 2000: A market index composed of 2,000 small-cap companies, widely used as a benchmark for small-cap mutual funds.
- Wilshire 5000: A market-capitalization-weighted index capturing the performance of all American stocks actively traded in the U.S., representing the broadest measure of the U.S. stock market.
- MSCI EAFE Index: An equity index capturing large and mid-cap representation across developed markets countries around the world, excluding the U.S. and Canada.
- MSCI Emerging Market Index: Captures large and mid-cap representation across emerging markets countries, covering approximately 85% of the free float-adjusted market capitalization in each country.
- VIX: The CBOE Volatility Index measures the market’s expectations for volatility over the coming 30 days, often referred to as the “fear gauge.”
- FTSE NAREIT All Equity REITs: Measures the performance of all publicly traded equity real estate investment trusts (REITs) listed in the U.S., excluding mortgage REITs.
- S&P U.S. Aggregate Bond Index: Represents the performance of the U.S. investment-grade bond market, including government, corporate, mortgage-backed, and asset-backed securities.
- 3-Month T-bill Yield (%): The yield on U.S. Treasury bills with a maturity of three months, reflecting short-term interest rates.
- 10-Year Treasury Yield (%): The yield on U.S. Treasury bonds with a maturity of ten years, reflecting long-term interest rates.
- 10Y-2Y Treasury Spread (%): The difference between the yields on 10-year and 2-year U.S. Treasury bonds, often used as an indicator of economic expectations.
- WTI Crude ($/bl): The price per barrel of West Texas Intermediate crude oil, a benchmark for U.S. oil prices.
- Gold ($/Troy Oz): The price per troy ounce of gold, a standard measure for gold prices.
- Bitcoin: A decentralized digital currency without a central bank or single administrator, which can be sent from user to user on the peer-to-peer bitcoin network.
This content was developed by Cambridge from sources believed to be reliable. This content is provided for informational purposes only and should not be construed or acted upon as individualized investment advice. It should not be considered a recommendation or solicitation. Information is subject to change. Any forward-looking statements are based on assumptions, may not materialize, and are subject to revision without notice. The information in this material is not intended as tax or legal advice.
Investing involves risk. Depending on the different types of investments there may be varying degrees of risk. Socially responsible investing does not guarantee any amount of success. Clients and prospective clients should be prepared to bear investment loss including loss of original principal. Indices mentioned are unmanaged and cannot be invested into directly. Past performance is not a guarantee of future results.
The Dow Jones Industrial Average (DJIA) is a price-weighted index composed of 30 widely traded blue-chip U.S. common stocks. The S&P 500 is a market-cap weighted index composed of the common stocks of 500 leading companies in leading industries of the U.S. economy. The NASDAQ Composite Index is a market-value weighted index of all common stocks listed on the NASDAQ stock exchange.
Securities offered through Cambridge Investment Research, Inc., a broker-dealer, member FINRA/SIPC, and investment advisory services offered through Cambridge Investment Research Advisors, Inc., a Registered Investment Adviser. Both are wholly-owned subsidiaries of Cambridge Investment Group, Inc. V.CIR.0726-2797