Weekly Market Commentary
August 18th, 2025
Week in Review…
Economic indicators released this week reflect a complex and evolving macroeconomic landscape, marked by persistent inflationary pressures and a labor market that remains resilient but shows early signs of moderation.
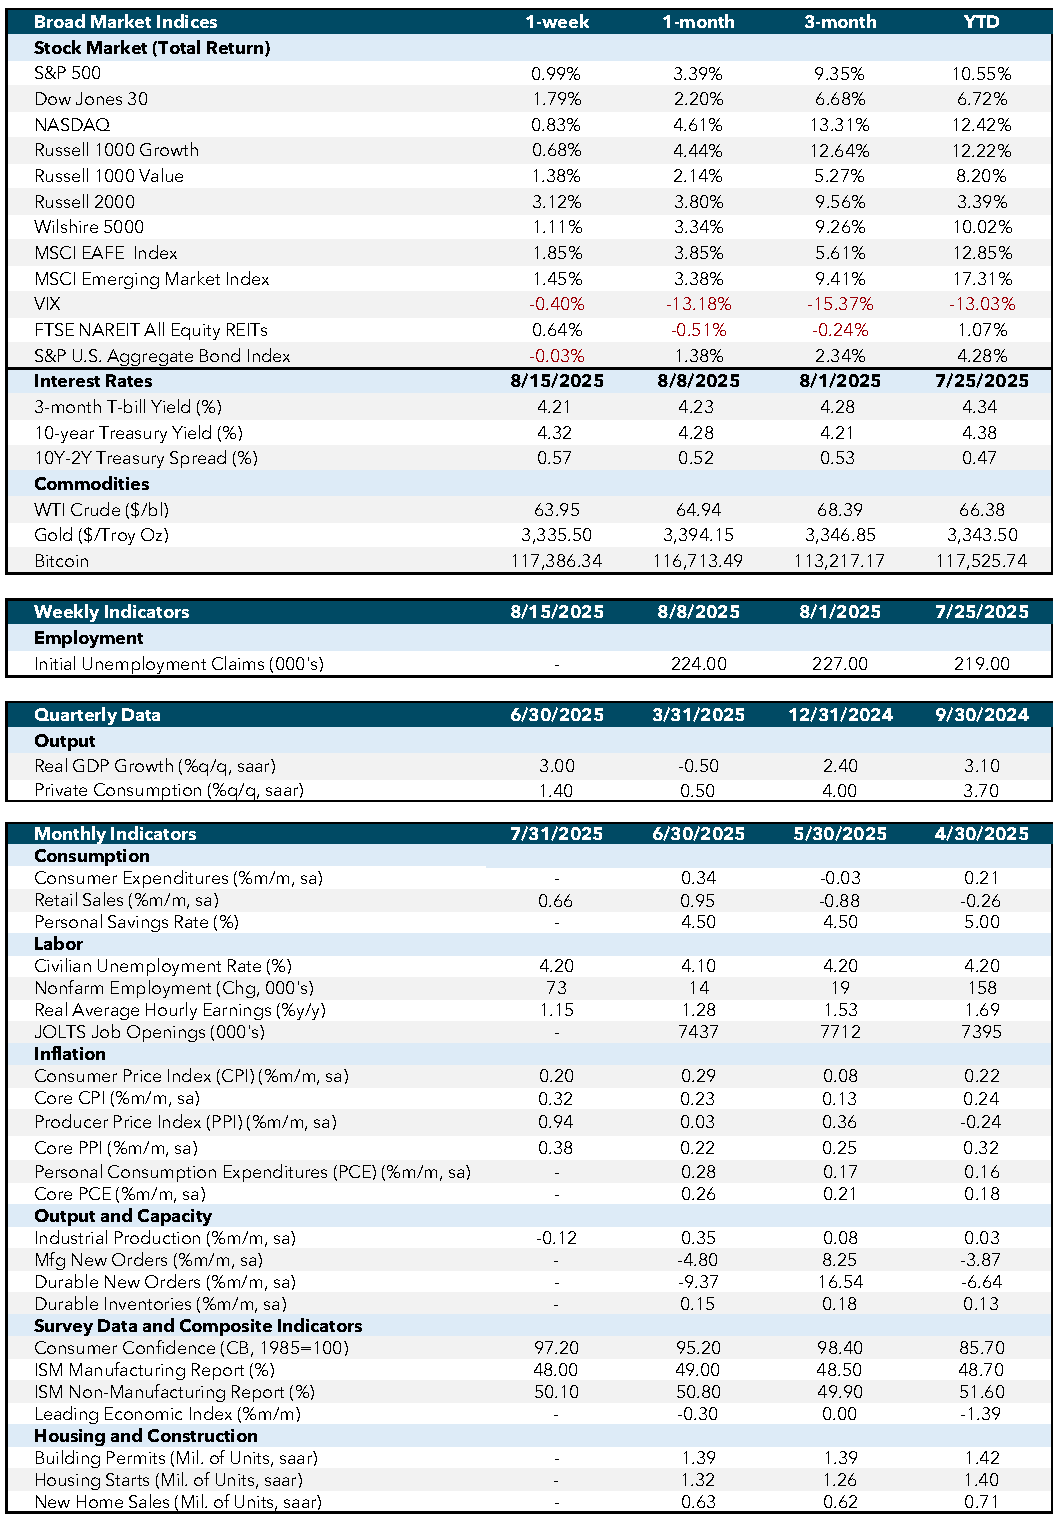
In July, the Consumer Price Index (CPI) rose 0.2% from the previous month of June, and 2.7% compared to the previous year. Core CPI — which excludes the more volatile food and energy components — climbed 0.3% month-over-month and 3.1% year-over-year, marking its highest annual increase since February. These figures indicate that inflation remains persistent, which may lead the Federal Reserve to maintain a cautious stance on monetary policy.
Wholesale inflation accelerated sharply, with the Producer Price Index (PPI) surging 0.9% month-over-month, marking the largest monthly increase in more than two years. The Core PPI, which excludes volatile components, rose 3.7% year-over-year, driven by increases in trade services and food categories. This points to rising wholesale costs that could feed into consumer prices.
Retail sales rose 0.5% in July, backed by strong auto demand and promotional events by prominent retailers. Core retail sales also increased 0.5%, suggesting resilient consumer spending, particularly on durable goods and online purchases, despite both inflation and tariff pressures.
Labor market data showed modest softening, with the initial jobless claims falling to 224,000, down 3,000 from the prior week. Continued claims dropped to 1.95 million, and the insured unemployment rate held steady at 1.3%, suggesting that while employment remains stable, hiring momentum may be easing.
Overall, recent data paints a picture of the economy that is growing steadily but is facing persistent inflationary pressures. Rising wholesale and consumer prices, coupled with resilient consumer demand and a gradually cooling labor market, suggest that the Federal Reserve is likely to remain vigilant. Market expectations for a September rate cut have moderated, with investors now anticipating a smaller adjustment than previously forecast.
Economic and Capital Markets Dashboard
Week Ahead…

Looking ahead, the upcoming week will feature several key economic releases and events that could shape market sentiment and inform monetary policy expectations. On Tuesday, the spotlight will be on the Building Permits and Housing Starts for July, representing key indicators of future construction and economic momentum. A slowdown in this sector could signal weakening demand due to higher interest rates.
On Wednesday, the Federal Open Market Committee (FOMC) Meeting Minutes will be released, offering the public insight into the Fed’s internal discussions on inflation, employment, and interest rate strategy. With recent data showing persistent inflation and a gradually cooling labor market, markets will be closely parsing the tone and language for clues on the Fed’s policy trajectory heading into the fall.
Thursday will bring several critical reports, including initial jobless claims providing an updated view of labor market conditions, while the S&P Global Purchasing Managers’ Indices (PMIs) for manufacturing and services will offer a snapshot of business activity.
The week will culminate with a highly anticipated speech by Federal Reserve Chair Jerome Powell at the Jackson Hole Economic Policy Symposium on Friday. Powell’s remarks could prove pivotal in shaping expectations for the September FOMC meeting and beyond.
Economic Indicators:
- CPI: Consumer Price Index measures the average change in prices paid by consumers for goods and services over time. Source: Bureau of Labor Statistics.
- Core CPI: Core Consumer Price Index excludes food and energy prices to provide a clearer picture of long-term inflation trends. Source: Bureau of Labor Statistics.
- PPI: Producer Price Index measures the average change in selling prices received by domestic producers for their output. Source: Bureau of Labor Statistics.
- Core PPI: Core Producer Price Index excludes food and energy prices to provide a clearer picture of long-term inflation trends. Source: Bureau of Labor Statistics.
- PCE: Personal Consumption Expenditures measure the average change in prices paid by consumers for goods and services. Source: Bureau of Economic Analysis.
- Core PCE: Core Personal Consumption Expenditures exclude food and energy prices to provide a clearer picture of long-term inflation trends. Source: Bureau of Economic Analysis.
- Industrial Production: Measures the output of the industrial sector, including manufacturing, mining, and utilities. Source: Federal Reserve.
- Mfg New Orders: Measures the value of new orders placed with manufacturers for durable and non-durable goods. Source: Census Bureau.
- Durable New Orders: Measures the value of new orders placed with manufacturers of durable goods. Source: Census Bureau.
- Durable Inventories: Measures the value of inventories held by manufacturers for durable goods. Source: Census Bureau.
- Consumer Confidence (CB, 1985=100): Measures the degree of optimism that consumers feel about the overall state of the economy and their personal financial situation. Source: Conference Board.
- ISM Manufacturing Report: Measures the economic health of the manufacturing sector based on surveys of purchasing managers. Source: Institute for Supply Management.
- ISM Non-Manufacturing Report: Measures the economic health of the non-manufacturing sector based on surveys of purchasing managers. Source: Institute for Supply Management.
- Leading Economic Index: Measures overall economic activity and predicts future economic trends. Source: Conference Board.
- Building Permits (Mil. of Units, saar): Measures the number of new residential building permits issued. Source: Census Bureau.
- Housing Starts (Mil. of Units, saar): Measures the number of new residential construction projects that have begun. Source: Census Bureau.
- New Home Sales (Mil. of Units, saar): Measures the number of newly constructed homes sold. Source: Census Bureau.
- SA: Seasonally adjusted.
- SAAR: Seasonally adjusted annual rate.
Market Indices & Indicators:
- S&P 500: A market-capitalization-weighted index of 500 leading publicly traded companies in the U.S., widely regarded as one of the best gauges of large U.S. stocks and the stock market overall.
- Dow Jones 30: Also known as the Dow Jones Industrial Average, it tracks the share price performance of 30 large, publicly traded U.S. companies, serving as a barometer of the stock market and economy.
- NASDAQ: The world’s first electronic stock exchange, primarily listing technology giants and operating 29 markets globally.
- Russell 1000 Growth: Measures the performance of large-cap growth segment of the U.S. equity universe, including companies with higher price-to-book ratios and growth metrics.
- Russell 1000 Value: Measures the performance of large-cap value segment of the U.S. equity universe, including companies with lower price-to-book ratios and growth metrics.
- Russell 2000: A market index composed of 2,000 small-cap companies, widely used as a benchmark for small-cap mutual funds.
- Wilshire 5000: A market-capitalization-weighted index capturing the performance of all American stocks actively traded in the U.S., representing the broadest measure of the U.S. stock market.
- MSCI EAFE Index: An equity index capturing large and mid-cap representation across developed markets countries around the world, excluding the U.S. and Canada.
- MSCI Emerging Market Index: Captures large and mid-cap representation across emerging markets countries, covering approximately 85% of the free float-adjusted market capitalization in each country.
- VIX: The CBOE Volatility Index measures the market’s expectations for volatility over the coming 30 days, often referred to as the “fear gauge.”
- FTSE NAREIT All Equity REITs: Measures the performance of all publicly traded equity real estate investment trusts (REITs) listed in the U.S., excluding mortgage REITs.
- S&P U.S. Aggregate Bond Index: Represents the performance of the U.S. investment-grade bond market, including government, corporate, mortgage-backed, and asset-backed securities.
- 3-Month T-bill Yield (%): The yield on U.S. Treasury bills with a maturity of three months, reflecting short-term interest rates.
- 10-Year Treasury Yield (%): The yield on U.S. Treasury bonds with a maturity of ten years, reflecting long-term interest rates.
- 10Y-2Y Treasury Spread (%): The difference between the yields on 10-year and 2-year U.S. Treasury bonds, often used as an indicator of economic expectations.
- WTI Crude ($/bl): The price per barrel of West Texas Intermediate crude oil, a benchmark for U.S. oil prices.
- Gold ($/Troy Oz): The price per troy ounce of gold, a standard measure for gold prices.
- Bitcoin: A decentralized digital currency without a central bank or single administrator, which can be sent from user to user on the peer-to-peer bitcoin network.
This content was developed by Cambridge from sources believed to be reliable. This content is provided for informational purposes only and should not be construed or acted upon as individualized investment advice. It should not be considered a recommendation or solicitation. Information is subject to change. Any forward-looking statements are based on assumptions, may not materialize, and are subject to revision without notice. The information in this material is not intended as tax or legal advice.
Investing involves risk. Depending on the different types of investments there may be varying degrees of risk. Socially responsible investing does not guarantee any amount of success. Clients and prospective clients should be prepared to bear investment loss including loss of original principal. Indices mentioned are unmanaged and cannot be invested into directly. Past performance is not a guarantee of future results.
The Dow Jones Industrial Average (DJIA) is a price-weighted index composed of 30 widely traded blue-chip U.S. common stocks. The S&P 500 is a market-cap weighted index composed of the common stocks of 500 leading companies in leading industries of the U.S. economy. The NASDAQ Composite Index is a market-value weighted index of all common stocks listed on the NASDAQ stock exchange.
Securities offered through Cambridge Investment Research, Inc., a broker-dealer, member FINRA/SIPC, and investment advisory services offered through Cambridge Investment Research Advisors, Inc., a Registered Investment Adviser. Both are wholly-owned subsidiaries of Cambridge Investment Group, Inc. V.CIR.0825-3133